I am standing atop the only grave in the world deliberately situated beneath a refracting telescope. A 60-foot dome soars above the gleaming floor inlaid with concentric circles of polished wood, and underneath lies the body of James Lick. As one of the lucky few to purchase Bay Area property just before the 1848 gold rush, Lick was a man with deep pockets and big aspirations, and for his legacy he funded the construction of a gigantic refracting telescope atop Mt. Hamilton, near what is now San Jose. He also wanted to be buried with it.
Lick—a man so vain he originally planned to memorialize himself with a 500-foot-tall pyramid at 4th and Market in San Francisco—might have been surprised to learn the universe did not revolve around him. But modern cosmologists know better. From the surface of the earth, from high-flying balloons, and from satellites floating above Earth, a host of experiments are revealing new insights. In some ways little has changed in the 126 years since the Lick Observatory’s completion. San Francisco property is still worth a veritable fortune, and when it comes to questions of the size, shape, and history of the universe, scientists still look up at the night sky for answers. But they’ve gotten much, much better at looking.
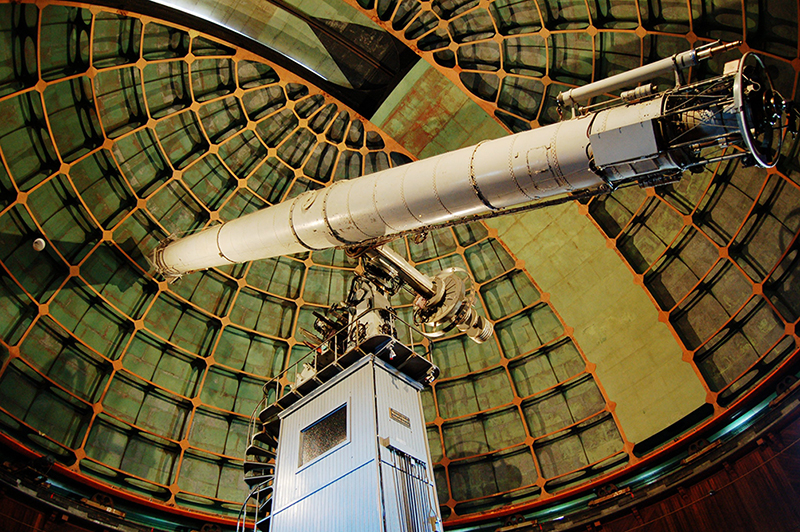 The James Lick Telescope, housed at the Lick Observatory at the summit of Mount Hamilton, was the world’s largest refracting telescope when it started taking data in 1888.
Stars connect the past and future
Eighty-five years ago, scientists discovered that the universe was expanding; 26 years ago, they realized the universe was not just expanding, but also accelerating. In recent decades the study of the universe has likewise been accelerating. “The state of cosmology today is just so different from how it was even ten years ago; now you have all this data that you can use to test different models and say definite things about what our universe is made of and what has happened at different points in its history,” says Michael Mortonson, a postdoctoral researcher in astronomy at UC Berkeley.
A much clearer picture of the history of the universe has emerged, thanks to innovative detection and analysis of the handful of photons arriving from outer space. “It’s amazing that we can piece out these stories from that little information,” says Saul Perlmutter, professor of physics at UC Berkeley, senior staff scientist at the Lawrence Berkeley Laboratory (LBL), and co-director of the Berkeley Center for Cosmological Physics (BCCP). Cosmology in 2014 is a field that makes headlines, makes controversies, and makes for ardent discussion of issues that transcend boundaries between scientific disciplines. The endeavors are welded—in some cases literally—to the mundane and to the past, as cutting-edge technology works in concert with anachronism to reveal the history of the universe in breathtaking detail.
Beginnings
Cosmology (from the Greek words kosmos, “world”, and logia, “study of”) seeks answers to questions asked since the first human looked up at the night sky, questions about events that precede humans by millions of millennia. “As a student, observational cosmology was… a musty corner of science,” recalls David Schlegel, senior staff scientist at LBL and principal investigator of the Baryon Oscillation Spectroscopic Survey (BOSS). Schlegel points out that even for much of the twentieth century, “everything was a twiddle,” meaning that cosmological quantities were preceded with a “~” sign—a twiddle—to show they were uncertain. “Books would say the age of the universe was ~10 billion years... and now we know the age of the universe to three decimal points.” At several hundreds of years old, cosmology is still a young field.
Sure, in 1621, Johannes Kepler had already worked out laws of motion for nearby planets—but nearly three centuries passed before theoretical and experimental foundations emerged to rigorously study anything beyond the solar system. In the early 1900s, Albert Einstein worked out the theory of general relativity, postulating that the presence of mass changes the shape of space itself. As physicist John Wheeler summarized, “matter tells space how to curve, and space tells matter how to move.” In 1919, during a solar eclipse, British astronomer Arthur Eddington observed starlight bending as it passed close to the sun, providing compelling experimental support for Einstein’s theory.
In 1929, Edwin Hubble carefully analyzed light from distant galaxies, and noticed something curious. Imagine listening to a siren passing by: as the source of the sound waves moves away, the spacing between arriving wave peaks stretches out and you hear a deeper pitch. Hubble noticed the same phenomenon in the light he observed. Photons (particles of light) always arrived with a redder color (longer distance between peaks) than they had when they departed, an effect called redshift. Redshift implies that the galaxies Hubble observed—all of them—were moving away. As Kyle Barbary, a Cosmology Data Fellow at BCCP, puts it, “everything that’s not nailed down moves apart.”
Hubble’s results had a fascinating corollary: if everything is expanding apart, then consider running a movie of the universe in reverse, towards the past. “The distances between all the points [get] increasingly small as you go backward in time,” Perlmutter explains. Taking this theory to the limit, we can rewind 13.8 billion years to confront the beginning of the universe, an event known as the Big Bang. Perlmutter points out the difficulty with the name “Big Bang”: it misleadingly implies “a bunch of material that is our universe flying out into empty space that preexists that is not the universe.” Put another way, if the universe is everything, what would be “outside” for it to expand into?
If that sounds confusing, you’re not alone. The concepts surrounding the Big Bang are unintuitive and difficult to grasp, and scientists have struggled to understand the early moments of the universe. What we do know is that distances become infinitesimal and the density of matter becomes unimaginably large as you go back in time. Perlmutter explains, “the last thing we really know about is a period when things were really dense and soup-like, but we don’t know before that—we’re struggling to make observations that will really tell us something.”
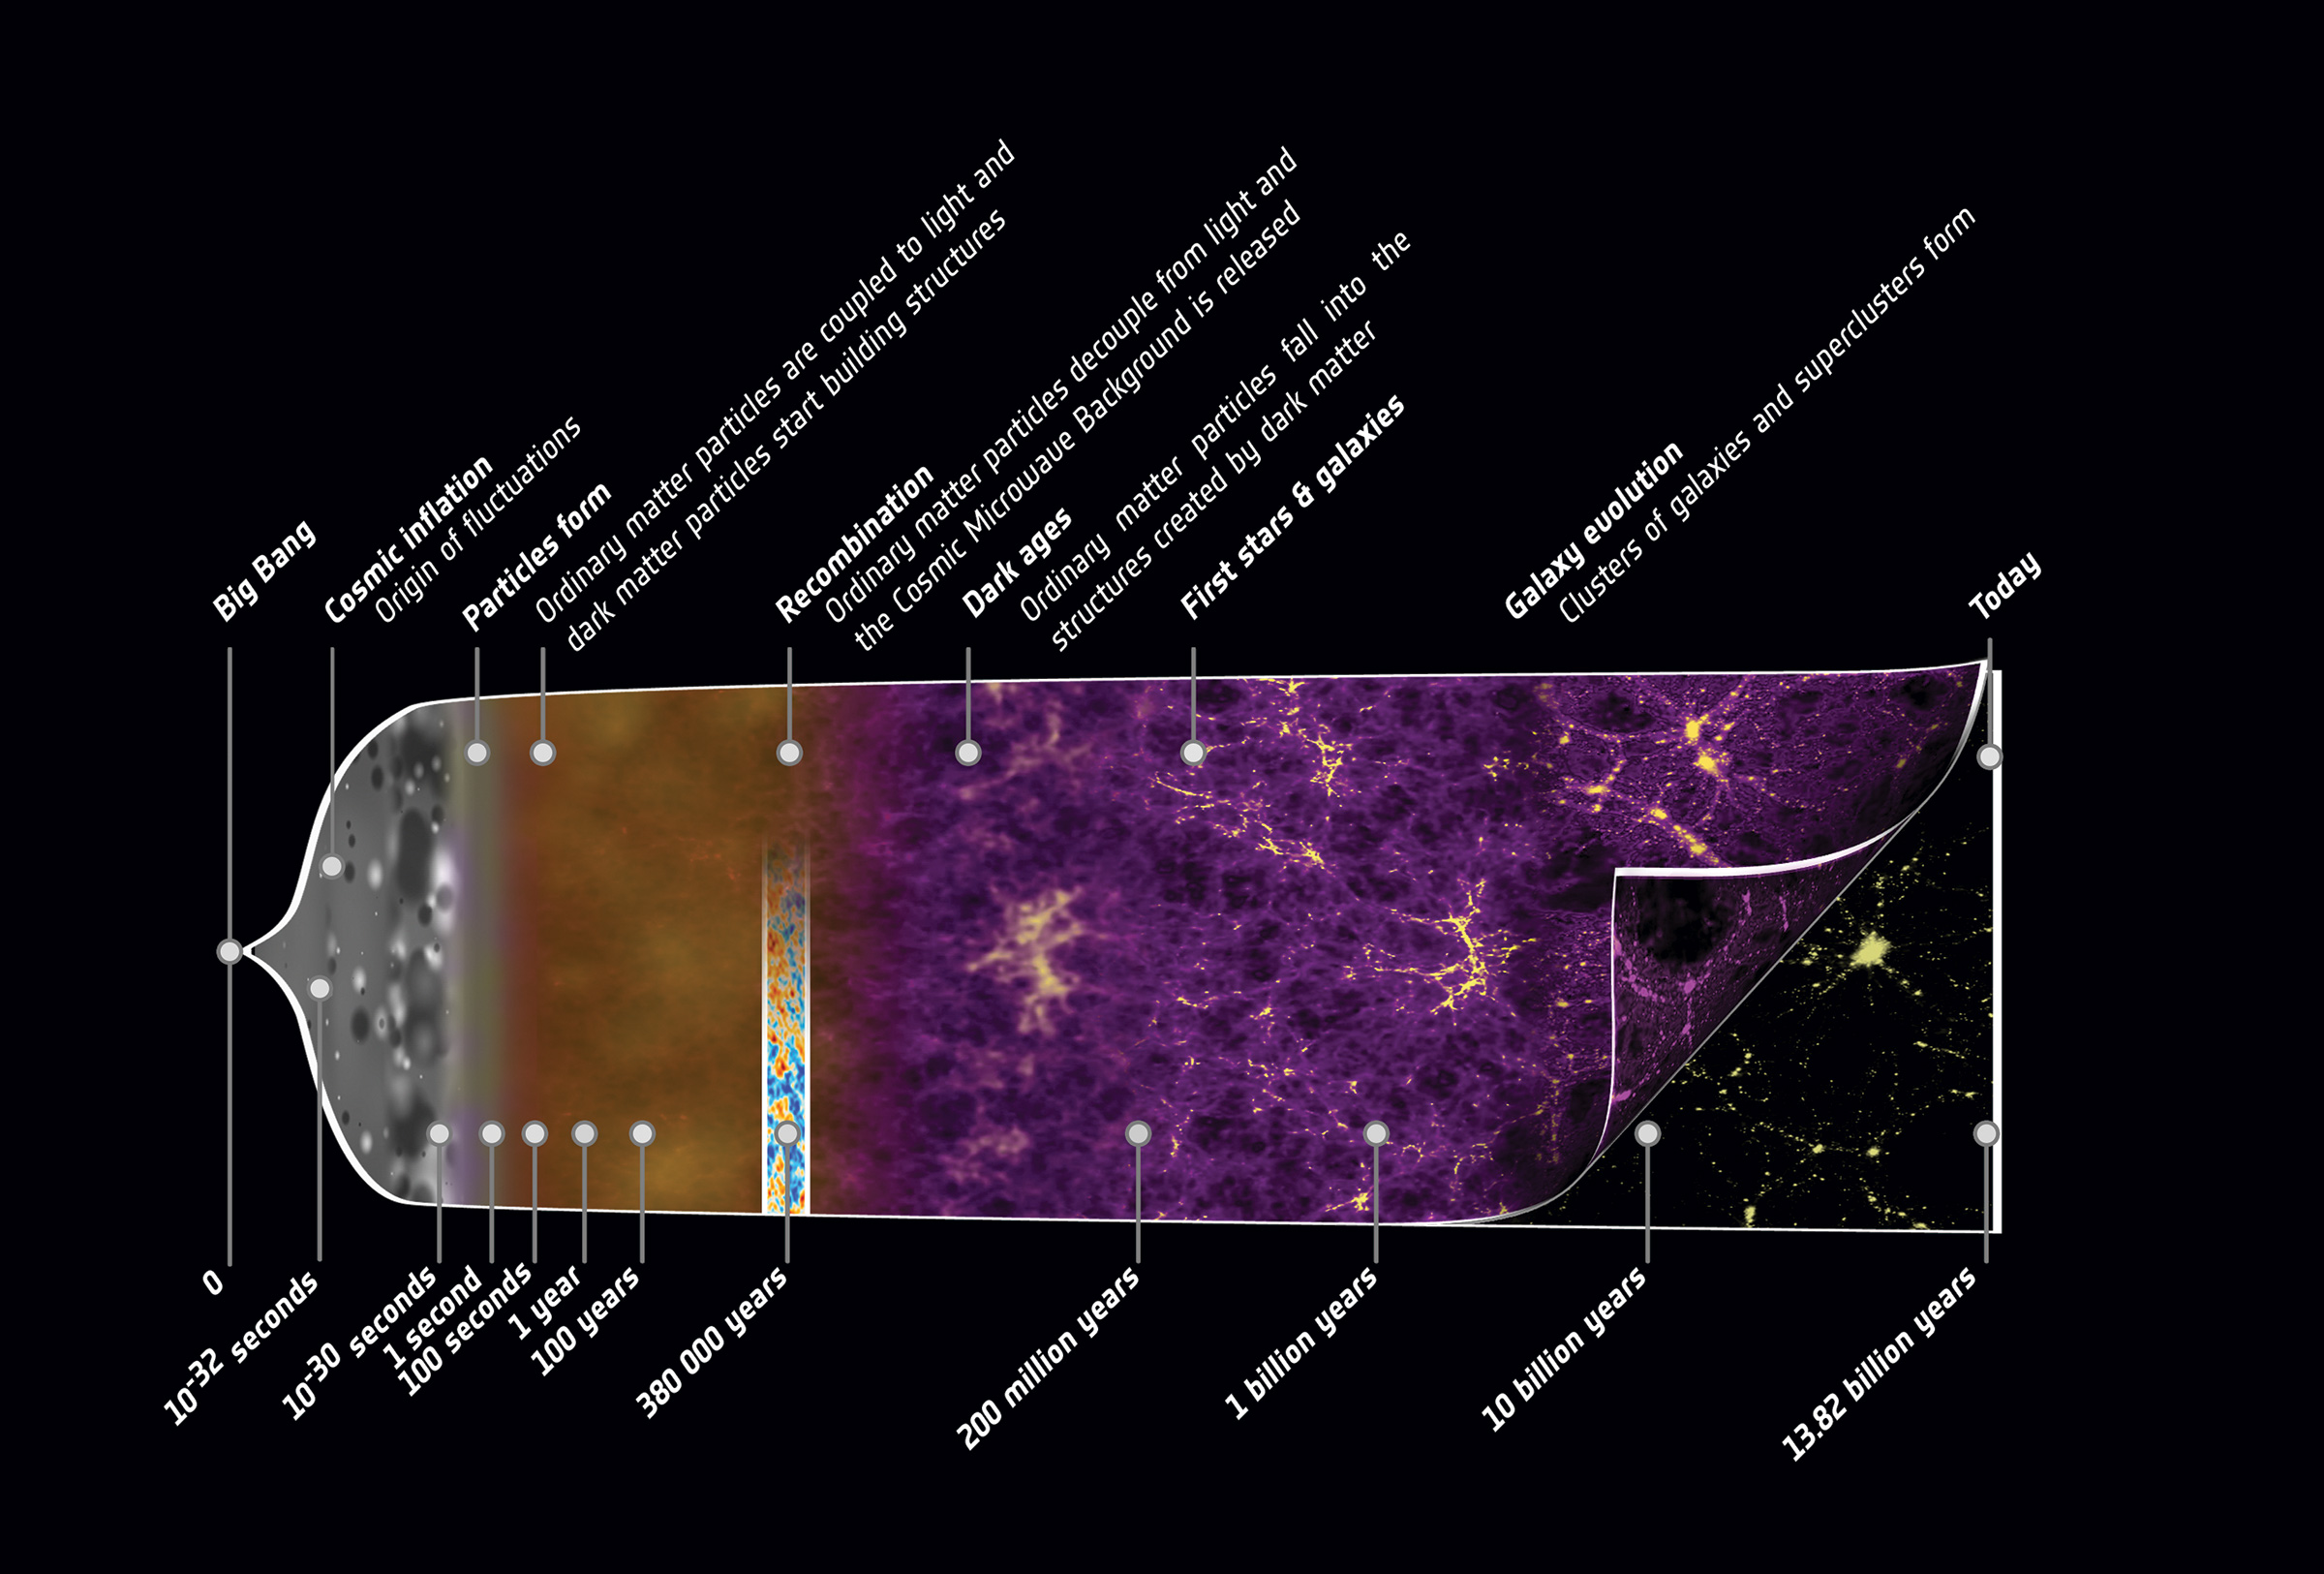 Expansion history of the universe, from the Big Bang to the accelerated expansion we experience today. Credit: ESA/C. Carreau
A host of projects continues to seek answers. “We’re all trying to measure the same thing, which is how the universe expanded over time. There are a few different probes that you can use to measure that,” explains Barbary. Typing a roster of experiments starts to feel like shouting a pro wrestling lineup: BOSS, Planck, BICEP2, PolarBeaR, MAXIMA, BOOMERANG, and WiggleZ, to name a few. To get a feel for modern cosmology—its growth spurt, growing pains, and deepening relationship with technology—look no further than the Berkeley Hills, where researchers at LBL and UC Berkeley have been watching exploding stars, mysterious matter, and some very old photons.
Supernovae and surprises
In the early 1990s, the Supernovae Cosmology Project at Lawrence Berkeley Lab, headed by Saul Perlmutter, was hunting an elusive creature: a certain type of dying star. Following Hubble’s discovery of ubiquitous redshift, most cosmologists assumed that the pull of gravity would slow the observed expansion, eventually halting or even reversing it. But no one had measured how the redshift was changing over time. To this end, Perlmutter’s team was searching for “standard candles,” supernovae that reliably give off a signature pattern of light. At the time, sightings were so rare that the International Astronomical Union would send out advisory telegrams whenever a telescope happened to spot one.
These stars die in a predictable way that observers can use to calculate both how far away they are and how quickly they are moving. This proves useful because looking at anything is looking back in time. Cosmologists see an object as it was when the light left that object. If you’re watching a soccer game from a distance of 30 meters, then you’re experiencing an unremarkable 10-nanosecond delay in the action. On distances cosmologists care about, this delay is billions of years longer, and more enlightening.
The Supernovae Cosmology Project systematically sought out and measured these standard candles at various distances using algorithms, rather than sleep-deprived humans, to recognize rare supernovae events among thousands of candidate bright patches in telescope data. Their goal was to see how quickly the universe had expanded at different times, going back billions of years into the past. For months, the frustrated team tried to fix possible bugs, since their data unexpectedly showed that everything moved apart faster and faster as time went by. But in 1998, they released their surprising results: there were no bugs, and the expansion of the universe was, in fact, accelerating. Within a few weeks, another collaboration called the High-Z Supernovae search team released independent data confirming the measurement; members of both teams would later share a Nobel Prize.
Still in the dark
Researchers now believe all those bright stars—all the bits of ordinary matter, in fact—make up less than 1/20th of the stuff in the universe. The rest consists of what cosmologists call “dark matter” and “dark energy.” Imagine stumbling around a dark closet. If you bruise your shins tripping over a box, you know it is there even though you cannot see it. In the same way, dark matter is stuff we do not see, but whose presence can be inferred indirectly—for example, as it exerts a gravitational tug on visible galaxies.
“The ‘dark’ in dark matter refers to the fact that it doesn’t emit light or interact with light at all...it’s literally dark,” explains Barbary. Dark energy, on the other hand, is a placeholder name for whatever is causing space to gallop outward ever more rapidly; it might be stuff gravity acts upon in a novel way, or it might be an alteration to the theory of gravity itself. In the vast, dim closet of the universe, dark energy is a poltergeist shuffling boxes into patterns that don’t quite make sense. An answer—that the expansion of the universe is mysteriously accelerating—had uncovered more questions, and BOSS is one of many projects seeking to shed light on dark matter and dark energy.
David Schlegel counts galaxies—millions of them. As the principal investigator for BOSS, he and a team of scientists are mapping the universe one galaxy at a time. One of several surveys in the third generation of Sloan Digital Sky Survey (SDSS), BOSS peers into the nature of both dark energy and dark matter. Knowing the spatial location of millions of galaxies allows researchers to better understand the geometry of the universe. Furthermore, subtle correlations between locations of galaxies allow researchers to establish a so-called standard ruler, a length scale representative of where matter clustered in the early, soupy universe. This ruler is a way to see if theories of dark energy measure up.
The original SDSS started taking data in 1998, with a digital camera literally “worth more than its weight in gold,” Schlegel explains, referring to the high cost of its enormous silicon detectors. In 10 years, SDSS mapped out a million nearby galaxies—but as Schlegel points out, “‘nearby’ for us is one billion light years...for modern questions, it’s not the map that you want. It’s the backyard.” Thus, the BOSS project began taking data beyond the backyard in 2009, with more precision. Today BOSS has imaged over 1.5 million galaxies, seeing up to 6 billion years back in time.
BOSS doesn’t only map galaxies. Astronomy graduate student Casey Stark explains how a technique called the Lyman-alpha forest can be used to map out the distribution of dark matter. In a laborious process, researchers point thousands of individual fiber optic cables precisely at massive bright objects called quasars, collecting a detailed portrait of incoming light from each. These portraits, called spectra, are a bit like looking at light through a prism. Visible light is composed of photons with many different frequencies (colors). When you pass white light through a prism, the resultant rainbow of colors shows the strength of these different components. Similarly, the BOSS spectra sort out the components of incoming light from quasars, showing how much the different frequencies of photons contribute to the total.
Spectra divulge not just properties of the light source, but also what happened to the light along its journey to the detector. The BOSS collaboration uses spectra (“Seeing with a cosmic eye” infographic) to map out neutral hydrogen in the universe. Each spectrum corresponds to a line of sight, so the researchers end up with a pincushion-shaped data set of many of these lines of sight going outward from our position on earth.
To collect the spectra, large round aluminum plates must be drilled with thousands of pinprick holes. Each hole corresponds to the exact positions of quasars of interest. Then, a human being needs to plug in the fiber optic cables, one by one. New plates must constantly be drilled and plugged, since the position of the earth is constantly changing. Thousands of plates later, a wealth of data has emerged. In April 2014, the team used sophisticated statistics to combine these lines into a 3D map of dark matter throughout the universe and to precisely measure the standard ruler, paving the way for future investigations of dark energy.
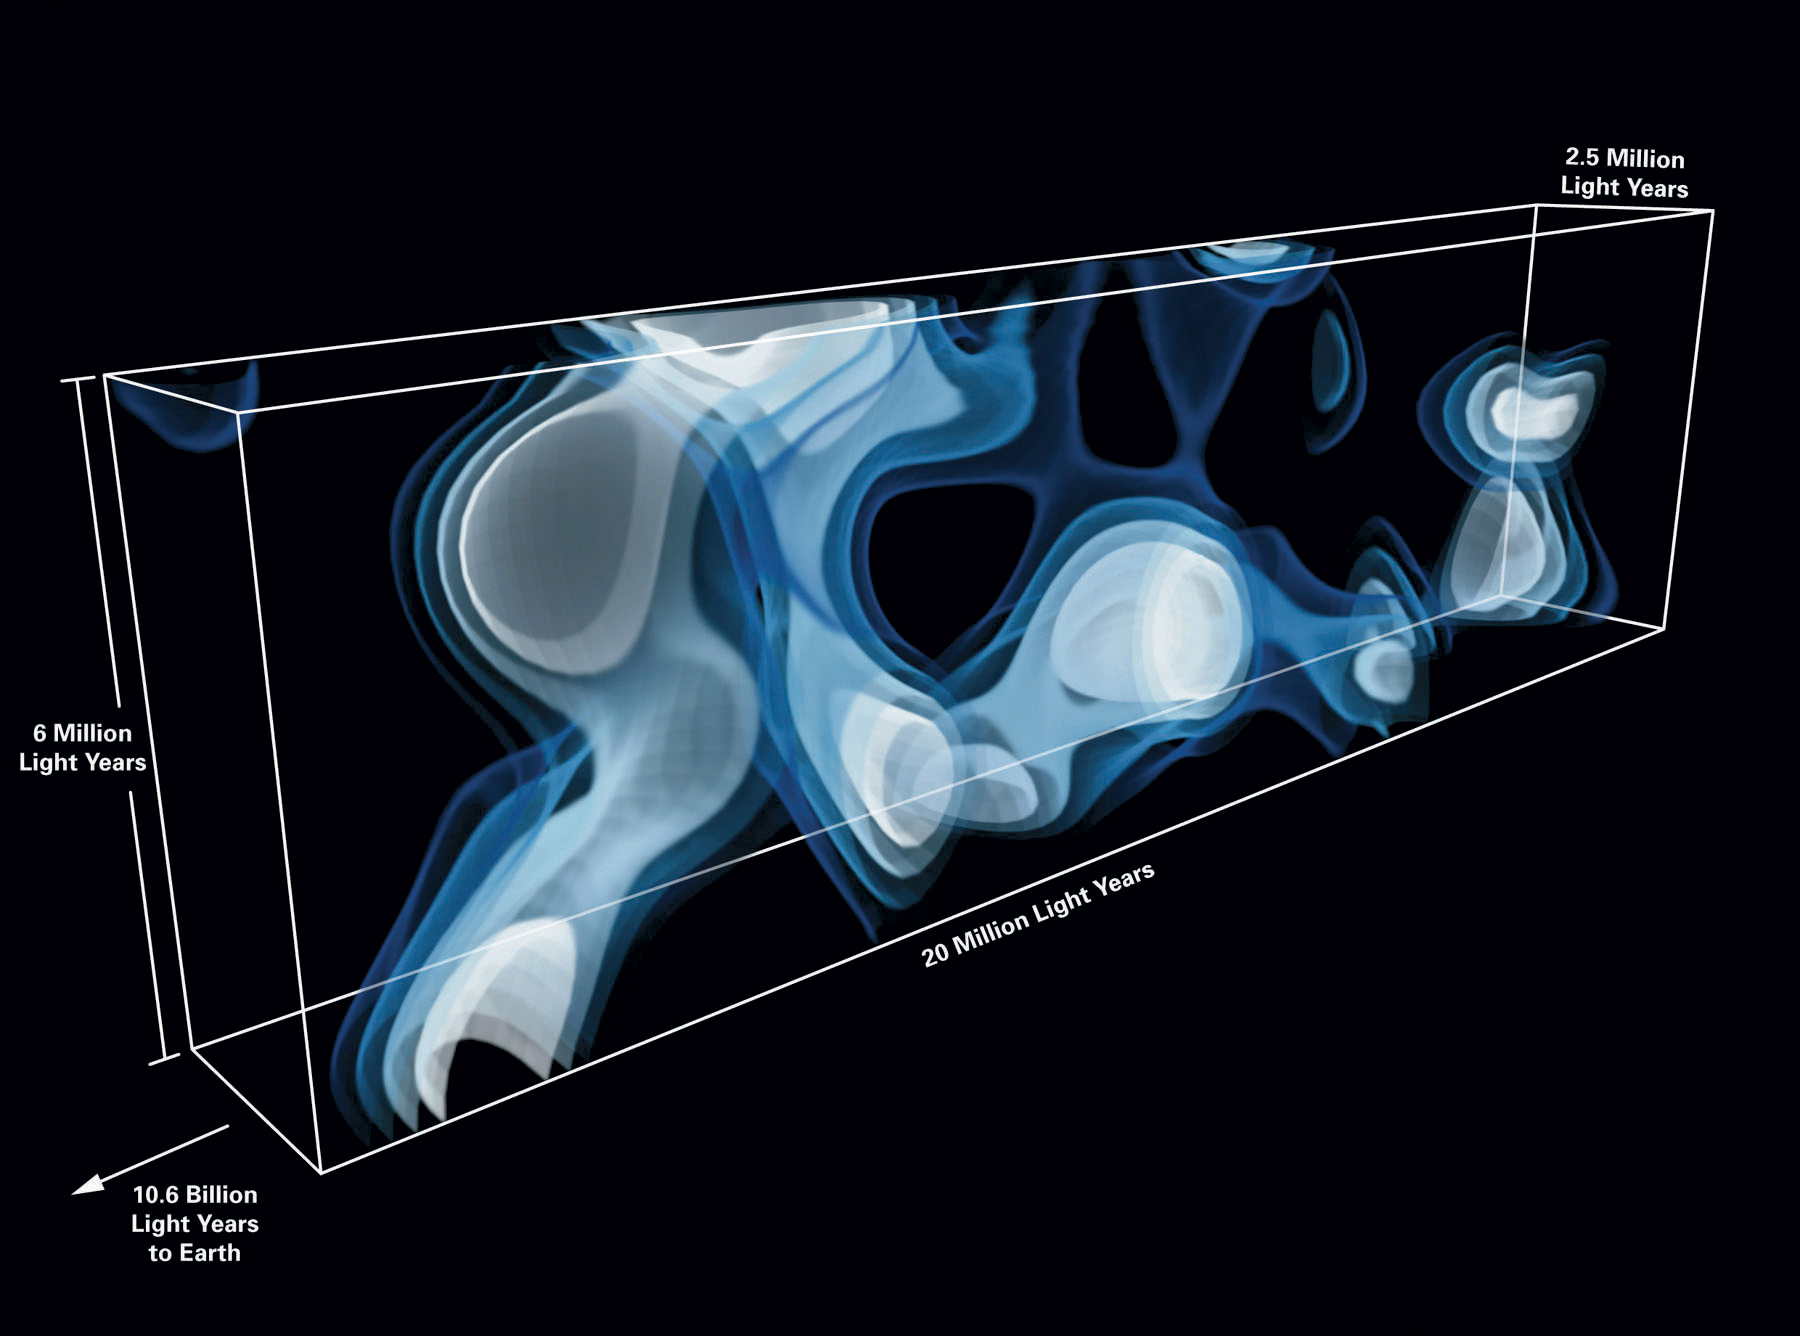 Close-up of 3D map of neutral hydrogen created by astronomers at Max Planck Institute for Astronomy and UC Berkeley. Region pictured is located about 11 billion light years away from Earth.
Background noise
In 1963, Arno Penzias and Robert Wilson, researchers at Bell Labs, were confounded by a persistent, uniform buzz their radio telescope kept picking up. They tried removing sources of noise—shooing away nesting pigeons and scraping off what Penzias delicately termed the “white dielectric substance” the pigeons left behind. These efforts failed—they never got rid of the noise, instead winding up with a Nobel Prize after realizing the annoying hum was not contamination, but rather photons from a critical time just after the Big Bang.
Just before this time, the universe was so hot and bothered that protons and electrons jostled about in a seething plasma in which even photons couldn’t travel far before banging into something. But after about 370,000 years, the expanding universe had cooled so much that pairs of electrons and protons settled into the calm monogamy of bound hydrogen atoms, and suddenly the early photons could fly free in all directions. These photons formed the near-constant buzz that had troubled Penzias and Wilson, a signal called the cosmic microwave background (CMB). Julian Borrill, Group Lead of LBL’s Computational Cosmology Center, explains that the CMB “is shockingly uniform—paradoxically uniform!”
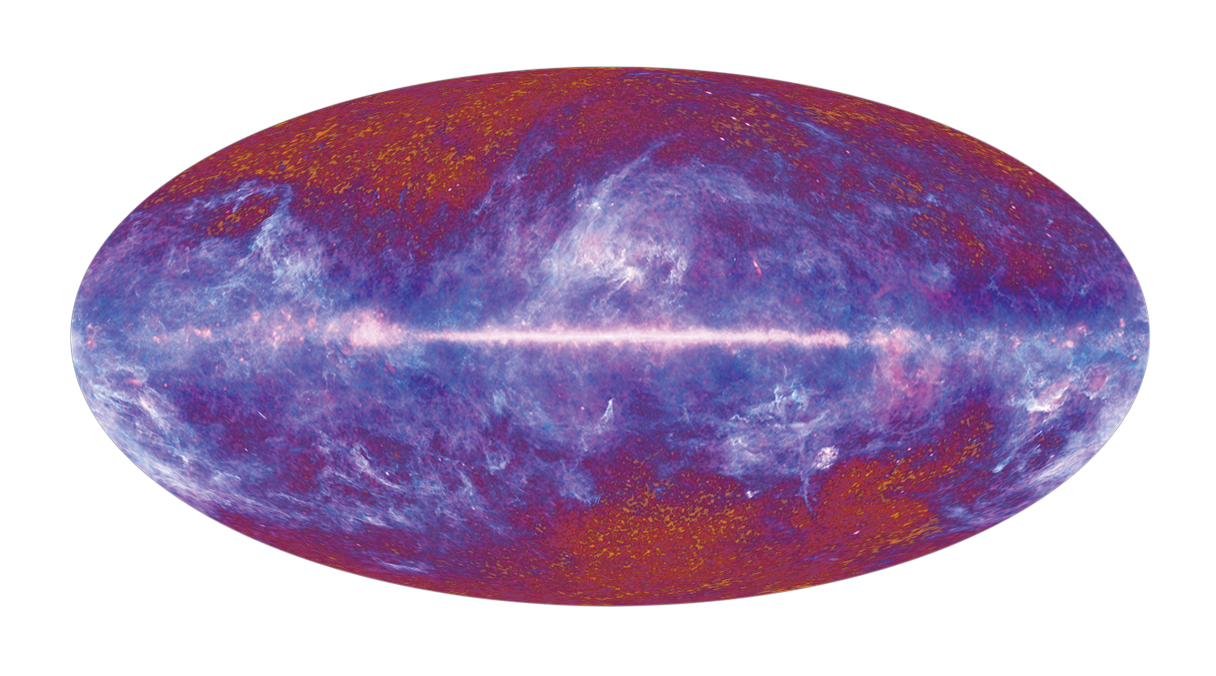 Planck satellite map of temperature fluctuations in the cosmic microwave background (CMB).
Studying small variations in the CMB has led to big discoveries. In the late 1970s, George Smoot, a physicist at LBL, and his team began scrutinizing the noise. In 1992 they released satellite data precisely mapping out the CMB across the entire sky. They saw tiny fluctuations—one part per million—corresponding to inhomogeneity in the early universe. Like chocolate chips in cookie dough batter, these blips were crucial to the future identity of the universe, giving rise to a lumpy collection of galaxies separated by vast regions of seemingly empty space. Smoot later shared a Nobel Prize for this discovery.
The CMB continues to be of interest to LBL scientists like Julian Borill, who studied mathematics and worked as a union organizer before a series of lunchtime lectures by Stephen Hawking lured him into cosmology. Borill has been unraveling the CMB with supercomputers since he arrived at LBL as a postdoc in 1997. At the time, he was using the big new Cray cluster to analyze data from the BOOMERANG balloon survey. BOOMERANG took data from a balloon released at McMurdough station in Antarctica. The balloon would catch the wind of a polar vortex and, after a few weeks of taking pictures of the CMB, whirl back around to land where it started. Now, Borrill works with data from the Planck satellite running statistical analyses on the images that it captures. His goal is to uncover the underlying physics most likely to produce the observed snapshot, which Borrill describes as the “particular random realization that we see from our particular point in the universe.”
Maps of the CMB caught a lot of attention in 2014. In March, the BICEP2 collaboration announced a celebrated, then contested, result quantifying swirls in the pattern of CMB with observations from a sensitive South Pole telescope. The result put strict limits on allowable theories for the evolution of the early universe and lent support to a theory known as inflation. Borrill explains how the bland uniformity of the CMB has presented a major puzzle: “Any points more distant than the size of the full moon would not have been in causal contact at the time the microwave background fluctuations were set in. How can they be at exactly the same temperature?” He continues, “The idea [of inflation] is you take a small, causally connected region and exponentially expand it. So the entire visible universe today comes from one causally connected region in the very very very very very very early universe.” That kind of expansion would leave faint swirls in the CMB, and observing them would be a big deal. “The day the results came out we all got together [to hear the results] at 8 am—which is rough for an astronomy crowd,” laughs Beth Reid, a Cosmology Data Fellow with BCCP.
But within days, in a debate that played out via Facebook, Twitter, and the blogosphere alongside traditional academic channels, the significance of the result was brought into question. Michael Mortonson explains that the BICEP2 team carried out a crucial uncertainty analysis step using a PDF of preliminary Planck data presented in a conference talk. Controversy ensued—well, even the existence of controversy is itself controversial—as the BICEP2 analysis was criticized for underestimating how much of their observation might be accounted for by the effect of dust within our own galaxy. Reid points out the PDF “became the center of the controversy because it was the best the rest of the world had.” In early July, a BBC press release reported BICEP2 and Planck had agreed to work together. In mid-September, Planck released an analysis suggesting that the entire BICEP2 result could be possibly—but not necessarily—chalked up to dust rather than the afterglow of inflation. The question remains open as the community waits for Planck’s next data release, slated for late November, and for the joint results from the nascent BICEP2/Planck collaboration.
Dealing with data
As the BICEP2 kerfuffle illustrates, data sharing is not an easy subject. “It is something where there is strong, almost religious conviction,” says Saul Perlmutter. Kyle Barbary points out, “the data is so hard-won that no one wants to give [it] away … You design, build, execute an experiment to collect the data; you’re going to try to get as much out of it as you can before releasing it.” A self-professed champion of open-source software, Barbary sees software and data through different lenses. Software tools, he argues, can only be published once, whereas researchers can perform many different analyses on a single data set.
It’s not always up to the researchers to decide if and when to release data, “federal funding means you can’t sit on data forever,“ Schlegel points out. However, requirements may take years to go into effect. “And with private funding,” he adds, “anything goes.”
Schlegel considers public data releases an important aspect of the BOSS project, yet remarks, “we do this big public data release and then all our competitors [beat] us with our own data.” Perlmutter notes that dealing with this sort of tension will require a cultural shift in the attribution of scientific discoveries—no easy task. “Many scientists are motivated by the fun of getting to be the first person to see the answer to a question that they formulate—so it’s not necessarily a simple matter to give people credit for supplying the data from which someone else will get to answer the question.”
Life on the edge (of computing)
Collecting data may be laborious and sharing it may be contentious—but a great deal of work remains once the sun comes up and the telescopes shut down. As Schlegel puts it, “analyzing can be a big deal. The difference in time between finishing the analysis and writing the paper is not even necessarily a positive number!” The analysis challenges in cosmology mirror those in fields such as climate modeling, materials science, and computational chemistry: researchers need to develop complex software and use some of the most powerful computers in the world to extricate conclusions from increasingly large data sets.
As one of Berkeley’s three Cosmology Data Science Fellows, Kyle Barbary’s work straddles the gap between physics and software development. “Whereas before we could get away with not doing things in quite the best way, it’s becoming more and more important—becoming necessary, in order to deal with these huge data sets—to really get the software side of things right,” he points out. He’s passionate about software being open source and easily reusable, so that researchers don’t need to reinvent the wheel as they analyze their data. Perlmutter, who also serves as director of the newly-established UC Berkeley Institute for Data Science (BIDS), points out that not only is software development critical within his field, but also across disciplines, as many scientists now have similar analysis needs.
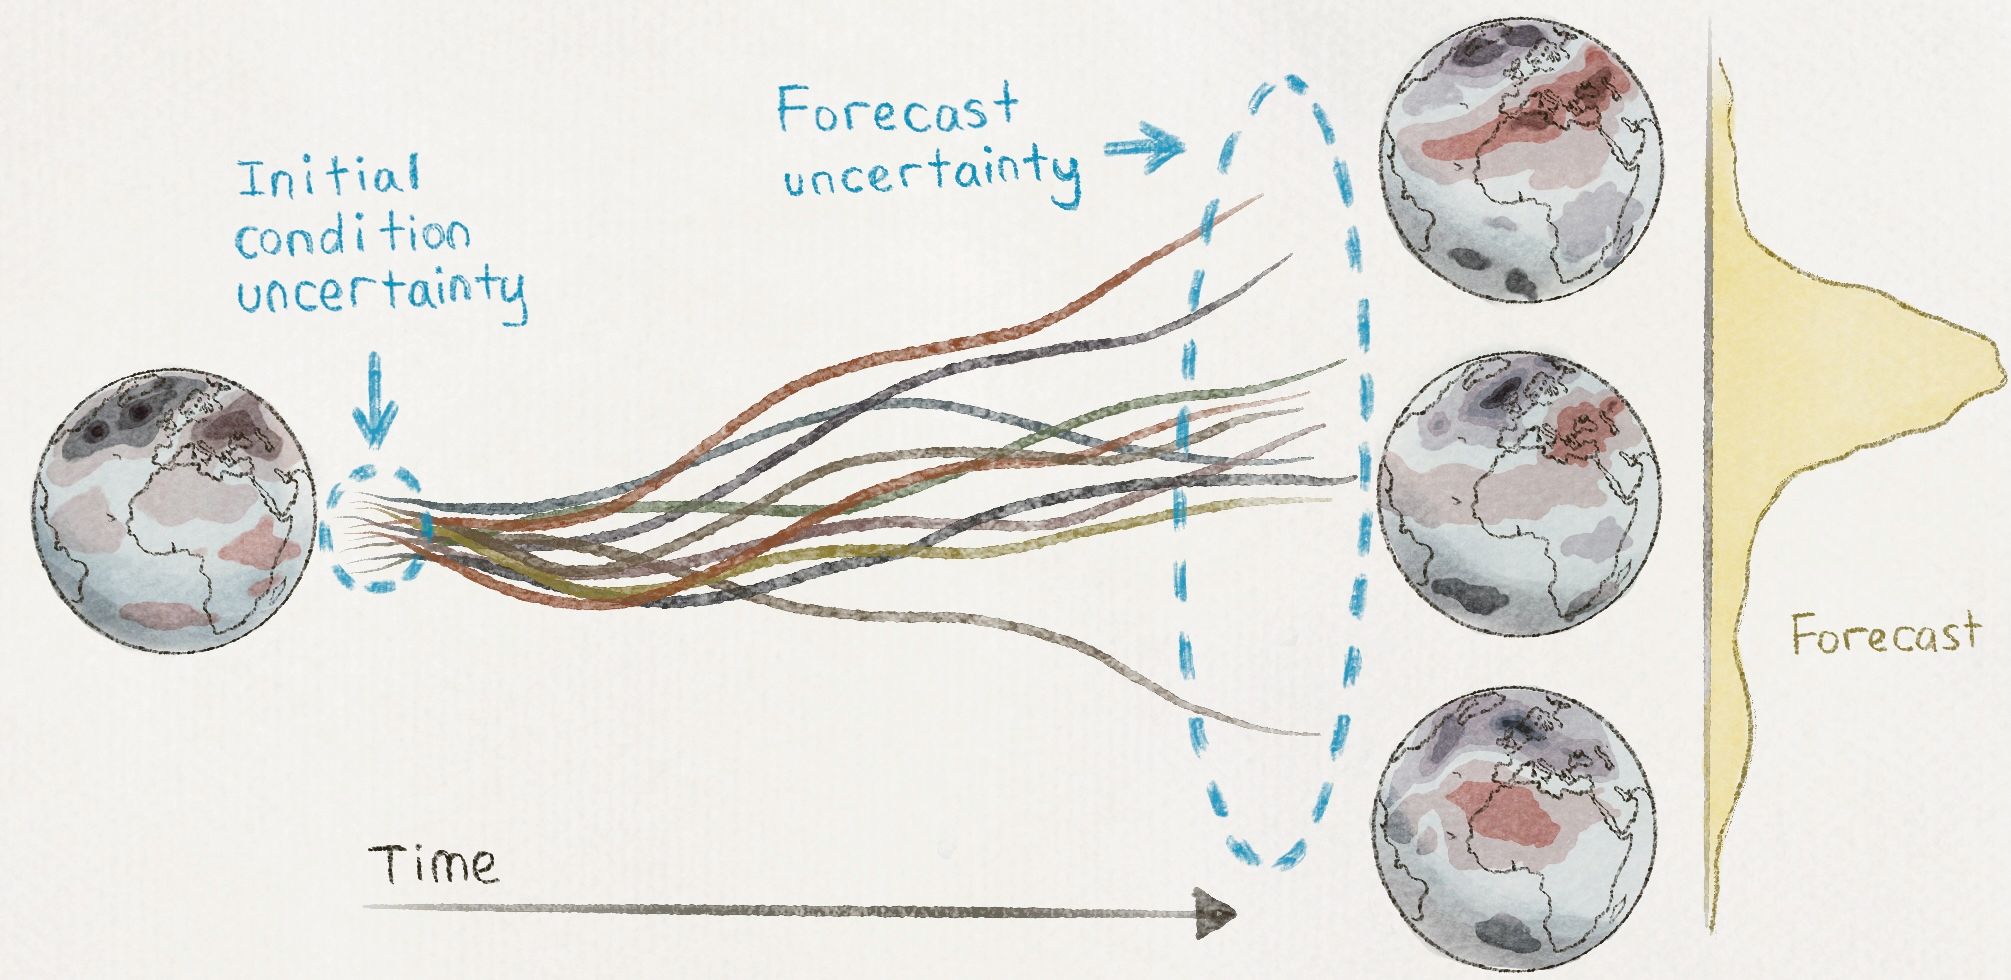
Hardware matters, too. “The data that goes into a single analysis run at one time is incomparably large,” Julian Borrill explains of the Planck satellite data. In 2000, when Borrill started laying the groundwork, his team needed to develop analysis techniques long before the data existed, crafting algorithms for hardware that hadn’t been built yet. “You’ve got five generations of supercomputer between your starting point and your ending point, and you can hope to trust in Moore’s law [that computing capacity will double roughly every two years], but you have no idea how Moore’s law is going to be achieved,” he says. Generating a map of the CMB requires not only analyzing Planck’s images, but also simulating the universe 10,000 times and then analyzing all those data sets, too. In 2006, making a single map took six hours, using the entire computing power of NERSC’s biggest machine. That time has fallen significantly, but, as Borrill puts it, “we’ve got to stay on the leading – or bleeding—edge of computing.”
Looking ahead
The International Astronomical Union no longer bothers to send out telegrams when someone observes a standard candle—and not only because telegrams have fallen out of fashion. The length of the roster of these supernovae has increased from 42 to over 700, and sightings no longer qualify as rare events. Yet Perlmutter and Barbary, among others, are continuing to hunt supernovae, with projects including the Nearby Supernova Factory and Joint Dark Energy Mission. They hope that increasingly precise measurements will help narrow the field of theories purporting to explain the evolution of the universe. “We’re still finding surprises,” Perlmutter points out, “and as long as you’re seeing the surprises, that’s probably a good field to be pushing.”
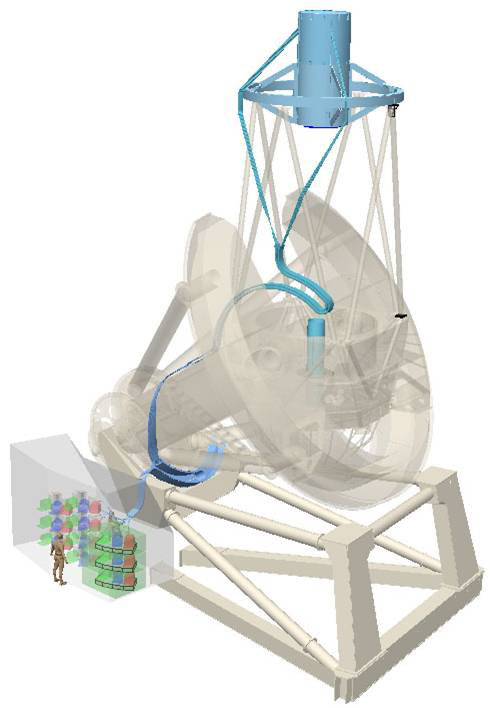 A schematic of the future DESI hardware.
BOSS is also looking ahead to piece together more of the story. The next generation of BOSS (originally called “BigBOSS,” since renamed DESI for Dark Energy Spectroscopic Instrument), introduces innovative technology to see more galaxies and tease out the history of both dark matter and dark energy. To cover more angular degrees of sky, the team designed novel corrective optics, and accelerated the process of sighting galaxies. No longer will a human being need to reorganize thousands of fiber optic cables by hand. Instead, 10,000 finger-sized robots will delicately direct the fibers, with micrometer precision, to point at individual galaxies. This futuristic array will rest squarely on the shoulders of the Mayall Telescope, a 40-year-old telescope on Kit Peak in New Mexico.
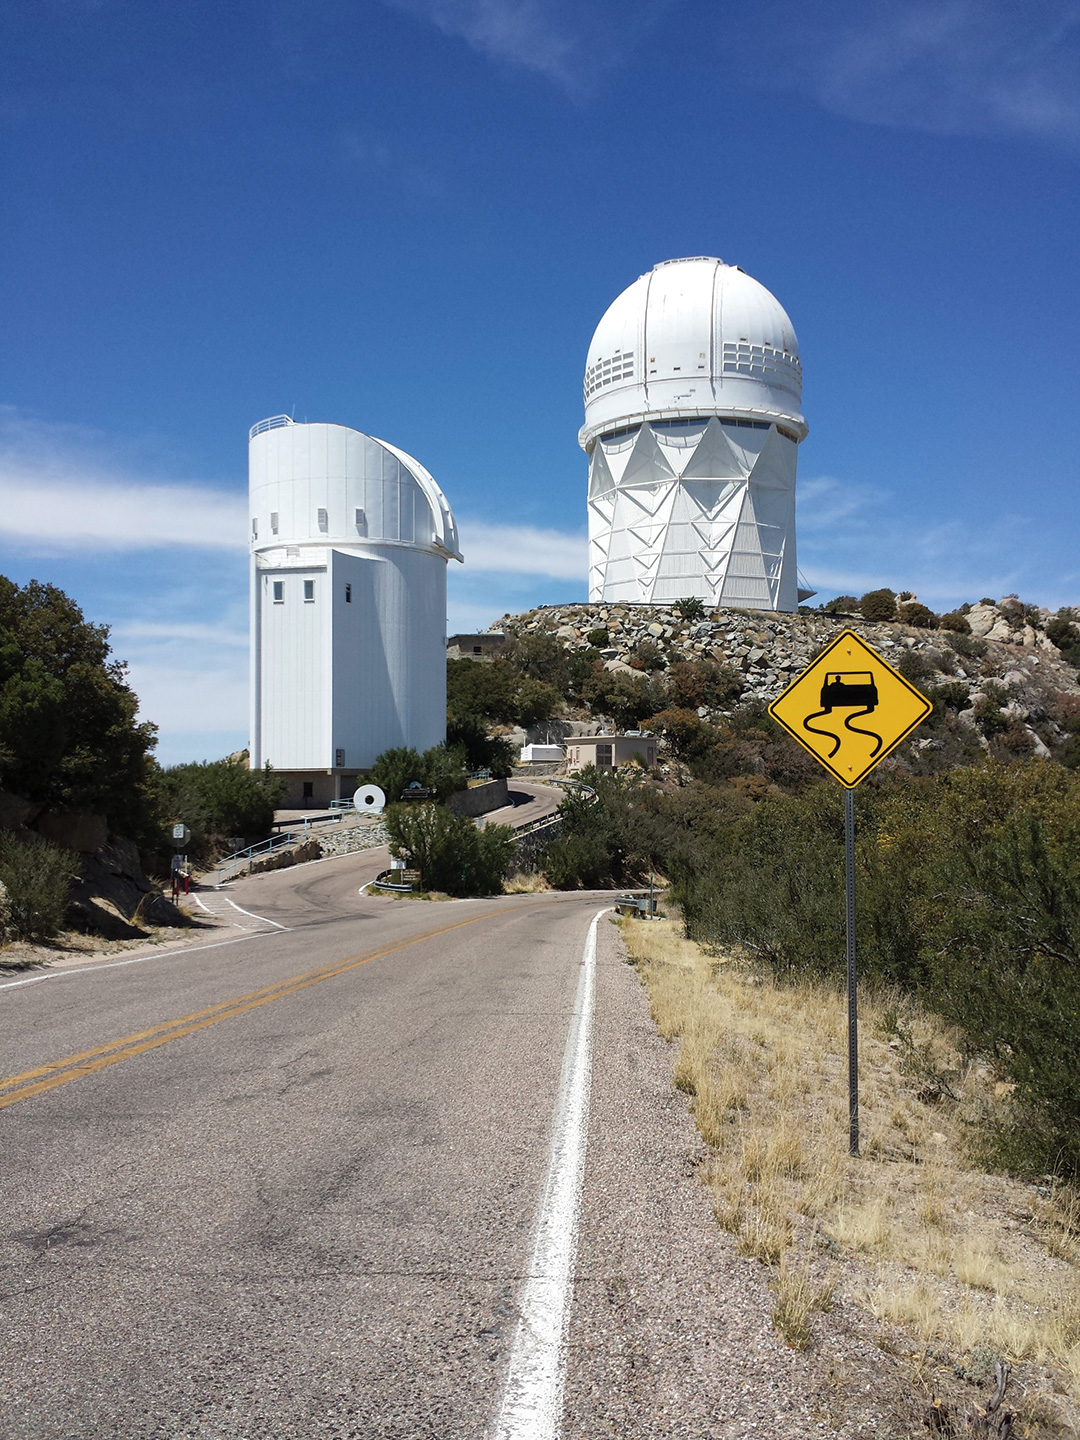 The Mayall telescope on Kit Peak, New Mexico, upon which DESI will rest.
David Schlegel points out, “Mayall Telescope is like a tank. Six hundred tons of moving weight—if you add two tons of glass it wouldn’t even notice.” Newer telescopes are so carefully and cost-effectively engineered, he says, they’d buckle under the weight of the DESI setup. Without a bulky, old-fashioned telescope to build on, he observes, “you’re out of luck.”
What comes after Planck, which stops taking data this year? Plans are being laid for CMB-S4, an enormous ground-based survey combining observations from telescopes in Antarctica, the Atacama Desert in Chile, and possibly Greenland. Half a million detectors will scan the sky, charged with the task of seeking out one-part-in-one-billion variations in the CMB. Merely getting massive datasets out of Antarctica poses a challenge, because data on hard disk cannot be physically transported out during the long Antarctic winter and the only satellites with a line of sight to the South Pole are those at the end of their lives. “So you only get to piggyback on dying satellites,” Borrill explains. Integrating data from disparate sources will require exquisitely complicated error analysis. “The systematic effects are going to be bonkers,” Borrill laughs, cheerfully. Once recovered and analyzed (as early as 2020), the data from CMB-s4 will hopefully reveal even more about what transpired in the earliest moments of the universe.
Cosmology asks big questions, deep questions, origin questions. It encroaches on the domain of science fiction writers, theologians, and wild-eyed mystics. After a long, sometimes ungainly, adolescence, cosmology has blossomed into a fast-paced science where increasingly sophisticated technology extracts new knowledge from the same old sky, where theory and experiment volley numbers back and forth in the ambitious race to finish writing the history of the universe.
Soon enough, in New Mexico, 600 tons of metal and glass will pivot silently as robotic fingers flick five thousand hair’s width fibers into place. In Oakland, California, thousands of processors on one of the largest supercomputers in the world will create and destroy tens of thousands of digital replicas of the universe. On the arid flats of the Atacama Desert, on the wintery plains of Antarctica and Greenland, marvelous contraptions of silicon and carbon and steel will orient themselves, looking. Here at Mt. Hamilton, I am standing between the grave of a 19th century eccentric and a window into the known universe, waiting for what they find.
*Featured Image: Design: Helene Moorman
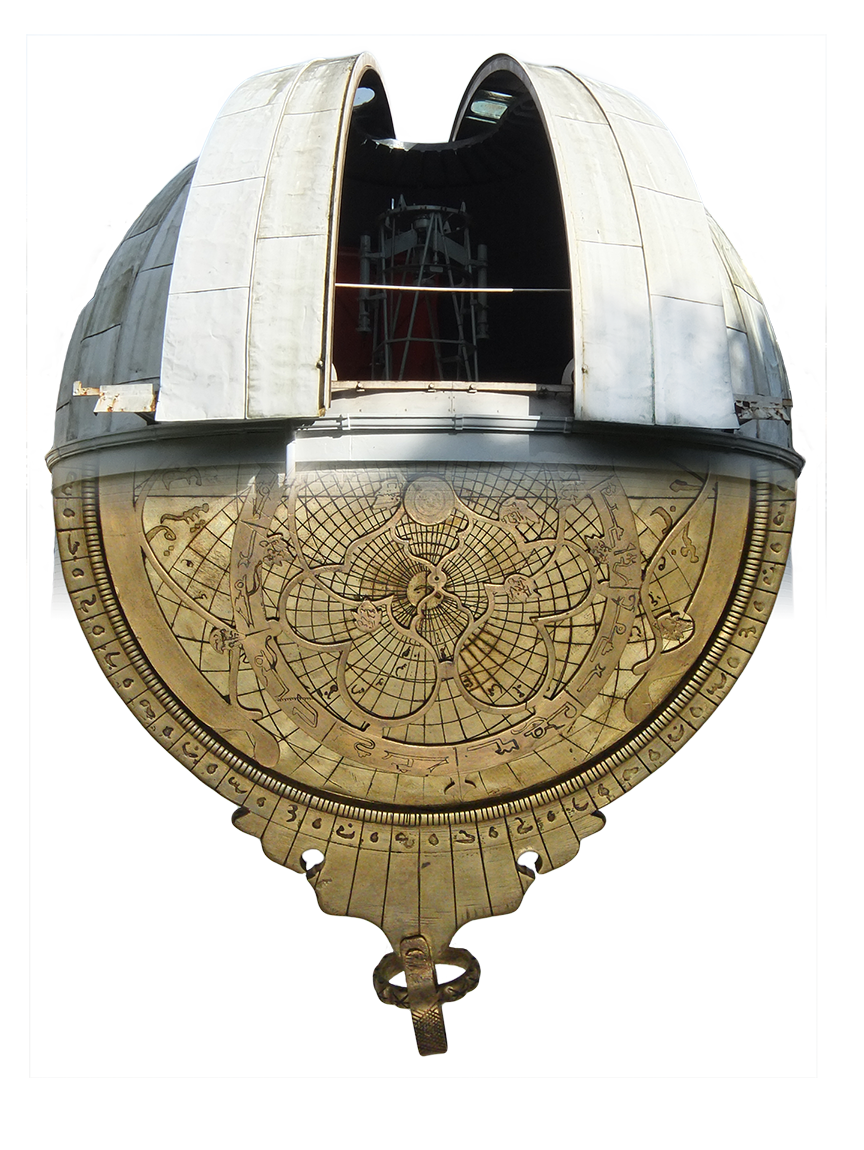
Observatory: Institute of Astronomy Library
Astrolabe: Jacopo188*
This article is part of the Fall 2014 issue.

